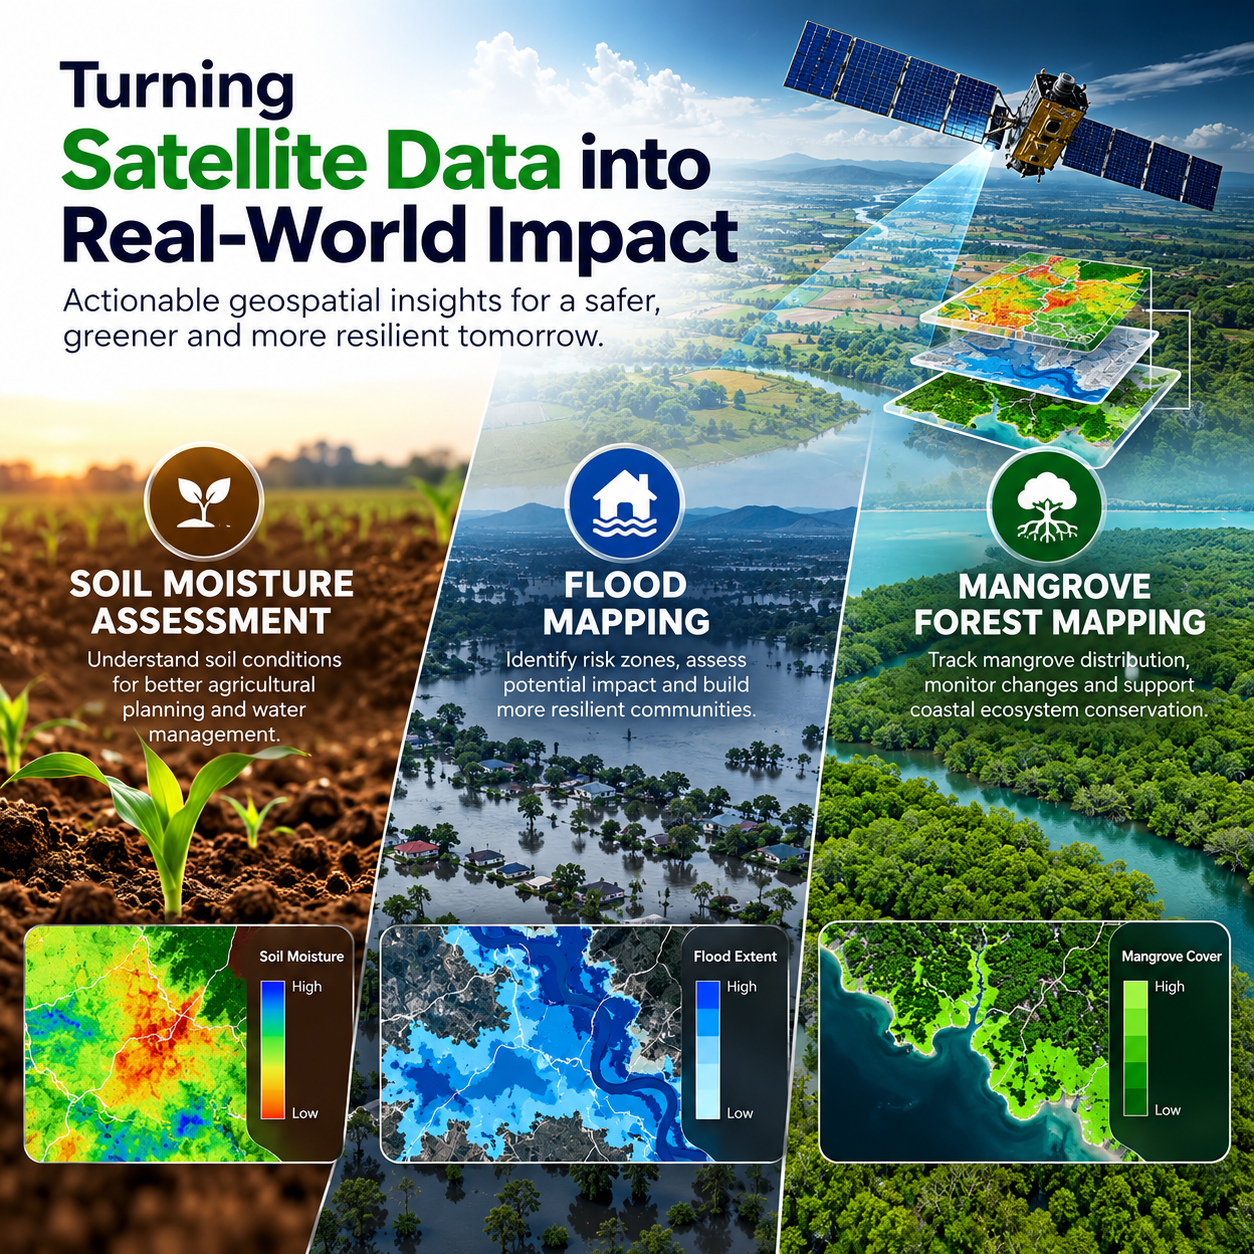



Understanding our environment requires accurate information about land, water, vegetation, and changing weather conditions. Satellite imagery and geospatial technologies help researchers, environmental professionals, and decision-makers observe large areas, identify patterns, and develop a clearer picture of environmental change.
From assessing soil moisture for agricultural planning to mapping flood-prone areas and monitoring mangrove forests, satellite-based analysis can transform complex datasets into practical maps and statistics. These insights can support better resource management, environmental monitoring, and informed planning.
How Satellite Data Supports Environmental Assessment
Earth observation satellites collect information about the Earth's surface using different sensing technologies. Multispectral imagery captures information across multiple wavelengths, while microwave radar data can provide valuable observations even under cloudy conditions. Digital elevation models (DEM) describe terrain characteristics and help explain how elevation influences water movement and landscape patterns.
When combined with ground observations, historical records, and geospatial analysis, these datasets can support environmental assessments across agricultural landscapes, flood-affected regions, and coastal ecosystems.
The value of satellite data lies not only in collecting imagery but also in processing it into meaningful outputs such as thematic maps, area statistics, and change assessments.
Soil Moisture Assessment for Better Agricultural Planning
Soil moisture influences crop development, irrigation requirements, and the movement of water through agricultural landscapes. Understanding how moisture varies across an area can help support agricultural assessment and water resource planning.
Satellite-based soil moisture assessment can use microwave radar observations, including Sentinel-1 imagery with different polarizations. Ground control observations containing measured soil moisture information are important for comparing satellite-derived results with conditions observed on the ground.
By combining these datasets through appropriate analysis, specialists can produce soil moisture maps and supporting statistics. These outputs can help identify spatial variations in soil conditions and provide additional information for agricultural planning and monitoring.
The reliability of the assessment depends on data quality, ground observations, processing methods, and local environmental conditions.
Flood Mapping for Hazard Assessment and Damage Analysis
Floods can affect homes, infrastructure, agriculture, transportation networks, and natural environments. Mapping inundated areas helps identify where flooding has occurred and supports the assessment of potential hazards and damage.
Flood mapping can combine multispectral imagery, microwave satellite data, digital elevation models, and historical flood inundation maps. Each dataset contributes different information: satellite imagery helps identify surface conditions, radar can assist with flood detection under cloudy conditions, and elevation data supports terrain-based analysis.
Historical flood information can provide additional context for delineating potential hazard zones and understanding changes in inundation patterns.
The resulting flood hazard zonation and damage assessment maps, together with area statistics, can help stakeholders understand the extent and distribution of affected areas. These outputs can support planning and assessment, although their accuracy depends on data availability, timing, validation, and the characteristics of each flood event.
Mangrove Forest Mapping for Coastal Ecosystem Monitoring
Mangrove forests are important coastal ecosystems that provide habitat for wildlife, support biodiversity, and contribute to shoreline stability. Monitoring their distribution over time helps researchers understand changes in coastal vegetation and identify areas that may require further investigation.
Satellite-based mangrove mapping can use multispectral imagery and vegetation-related indices to distinguish mangrove areas from surrounding land cover. Time-series data helps assess changes in vegetation distribution, while digital elevation models and ground-truth points can provide useful supporting information.
By comparing observations across different dates, geospatial analysis can help identify changes in mangrove coverage and distribution.
The resulting mangrove area maps, area statistics, and change dynamics assessments can support environmental monitoring, coastal planning, and conservation-related decision-making.
Why Combining Multiple Datasets Matters
Environmental mapping becomes more informative when different datasets are used together. Satellite imagery provides broad spatial coverage, elevation models add terrain context, historical records reveal changes over time, and ground observations help validate the results.
However, each application requires a suitable data strategy. Soil moisture assessment needs reliable ground control observations, flood mapping benefits from historical inundation information, and mangrove monitoring requires appropriate vegetation data and reference points.
Selecting suitable datasets, applying appropriate processing methods, and validating outputs are essential steps in producing useful geospatial information.
From Geospatial Analysis to Actionable Insights
Maps and statistics help make complex environmental information easier to interpret. Spatial patterns can reveal where conditions vary, while area calculations and time-series comparisons help quantify the extent of observed changes.
These outputs can support agricultural assessment, flood hazard analysis, damage estimation, and coastal ecosystem monitoring. They also provide a foundation for communicating findings to technical teams, planners, researchers, and other stakeholders.
The interpretation of these results should always consider data limitations, uncertainty, and the specific conditions of the study area.
Conclusion: Building a Better Understanding of Our Environment
Satellite data is a powerful resource for understanding environmental conditions across large and changing landscapes. Through soil moisture assessment, flood mapping, and mangrove forest monitoring, geospatial analysis can turn complex observations into maps and statistics that support more informed decisions.
Combining satellite imagery with ground observations, elevation data, and historical records helps create a more complete view of environmental patterns and change. With appropriate data selection, careful processing, and reliable validation, these methods can contribute to agricultural planning, hazard assessment, and coastal ecosystem monitoring.
N-Atech's environmental mapping services highlight how satellite datasets and geospatial analysis can be applied to practical challenges, helping transform Earth observation data into useful environmental insights.



Leave a reply